What is a Virus? – A Basic Description

A virus is a microscopic organism that can ‘infect’ all types of lifeforms, including animals, plants and even fellow microorganisms, including bacteria.

Found absolutely everywhere, viruses are believed to be the most abundant type of biological entity, outnumbering all others put together.

Around 5,000 distinct species have already been identified properly, with 75,000 different virus genomes currently listed in NCBI Virus Genome Database.

It is believed that there are actually millions of species of viruses in total on Earth.

Where have viruses evolved from?

It is not clear how viruses evolved, but they are found everywhere there is life present.

This has lead to the conclusion that they most probably have been around since living cells first evolved.

They are considered important for the past, present and future evolution of life on our planet, due to being a major source of ‘horizontal gene transfer’, which increases genetic diversity.

What does a virus look like?

Viruses are not in any way vague in terms of their physical appearance, with each species having it’s own distinct shape or form when viewed properly.

Some species are shaped long, others are round, whilst some virus species are very complex structures indeed.

They vary in size, but on average, viruses are one-hundredth the size of the average bacterium.

Most viruses can be viewed via transmission electron microscopes (TEM), with some large enough to be viewable via conventional optical microscopes.
What is a virus particle made from?

A complete virus organism/particle, known as a virion, consists of it’s DNA/RNA (Deoxyribonucleic acid/Ribonucleic acid) information, encassed within a protective coating of proteins.

Some viruses – including HIV – also have an extra membrane of lipids (fat’s, wax’s, nutrient’s, etc.) that is studded with the same proteins that it’s DNA/RNA is encassed within.

This extra layer is designed for added protection, which is particularly useful whilst it is travelling about looking for a host to infect.

How does a virus spread?

Viruses have found some highly imaginitive ways of transferring to new hosts.

Some viruses can be spread from host to host by travelling within an organism, like viruses that are replicating within one of us humans, or they can be spread via a number of other ways.

These include airborne methods (animals sneezing, viruses blowing in the wind independently, etc.), third party transfers (for example; plant viruses can spread from plant to plant, transferring via insects) and bodily fluid transfers.

The sea is also a perfect hunting ground for viruses, with as many as 250 million of them present in a millilitre of seawater, and they can also be found in soil and on every surface imaginable too.

How does a virus infect?

A virus ‘infects’ lifeforms by attaching itself to them, and entering them. It then disolves certain parts of itself, and replicates copies of itself within the host, based on the virus’ own DNA/RNA that was originally encassed within it’s proteins.

It performs this replication process completely by utilising the hosts resources.

Next, the many new multiples of that same virus break out from the host, often killing it, and those new virus organisms then go off searching for their own host lifeforms in order to begin that replicating process again individually, thus multiplying their numbers.

In some cases, a virus species can target only a single type of cell, others can infect multiple cell types, whilst others can even infect across completely different species.

Are all viruses bad?

Contrary to popular belief, viruses not only cause havoc by spreading harmful viral infections, but they can also be found performing useful functions in many cases of ‘infection’.

For example; some bacteriophages – a type of virus organism – kill bacteria organisms that are harmful to us humans, or to other species.

Viruses also play a key role in the undersea decomposition process that recycles carbon dioxide (co2), which provides underwater life, whilst keeping massive amounts of co2 out of our atmosphere.

They infect oceanic bacteria and other microorganisms, thus releasing organic matter when they break out from their host, which can then be used as food by other lifeforms.

Furthermore, it is estimated that 90% of the ocean’s biomass consist of microorganisms, and viruses kill around 20% of this daily, which helps to keep harmful algae from taking over our seas.

Are viruses alive?

Often classified – alongside viroids – as ‘non-cellular life’, there are arguments ongoing within the scientific community as to whether viruses should actually be considered lifeforms.

Whilst they carry genetic material, reproduce and evolve via natural selection, they do not have a cell structure, a requirement for a lifeform according to many popular scientific models.

Viruses also do not metabolize (the process which turns food into a form that can be used by a lifeform), and they require a host to replicate, so in reality, they could be viewed as lifeless objects, which contain genetic information (DNA/RNA), that float about until they find hosts to utilise specifically for making copies of themselves.

How can harmful viruses be treated in humans?

Antibiotics are ineffective against viruses, so we generally use vaccines to prevent virus infections before they arise, and antiviral drugs to treat infections that are present.

Vaccines can contain live viruses that are weakened or altered, dead viruses, or just parts of the virus.

Human vaccines now prevent over a dozen different viruses, and they work by training your immune system to fight a specific virus, for example; infleunenza, or a combination of viruses as is the case with the MMR vaccine (measles, mumps and rubella).

Some antiviral drugs are harmless to their host, however, others can be quite harmful to us in general, and toxic to certain cells, so we only use some types of these drugs if it is completely necessary.

Antiviral drugs don’t work by destroying their patogen – unlike antibiotics – instead they inhibit a viruses development, usually by messing with it’s replication process, which slows down it’s development, or stops it ultimately.

In some cases of infection, there are also a completely different set of treatments available called virucides (or viricides/viruscides), which are physical or chemical agents that deactivate or destroy viruses. 

Continue Reading ...
  • The Largest Continents In The World

    This is a list of the World’s continent’s, listed by total area, in accordance with the popular 7-continent model. Also included are figures for the total land area in km sq and miles sq, for each continent, percentage of overall global landmass, plus basic continent locator maps.

    Other widely-used continent models include the 6-continent model with Europe and Asia combined (Eur-Asia, North America, South America, Africa, Oceania, Antarctica), and the alternative 6-continent model which includes the America’s as one single continent (Europe, The Americas, Africa, Asia, Oceania, Antarctica).

    Please Note: These figures are just estimates, and may be slightly off when considering different interpretations of where the individual continents begin and end. They should only be used as a guide. All maps on this page are released into the public domain.


    1: Asia

    Total Land Area (sq km): 44,579,000
    Total Land Area (sq miles): 17,212,000
    % of Global Landmass: 29.5%


    2: Africa

    Total Land Area (sq km): 30,221,532
    Total Land Area (sq miles): 11,668,598.7
    % of Global Landmass: 20.4%


    3: North America

    Total Land Area (sq km): 24,709,000
    Total Land Area (sq miles): 9,540,000
    % of Global Landmass: 16.5%


    4: South America

    Total Land Area (sq km): 17,840,000
    Total Land Area (sq miles): 6,890,000
    % of Global Landmass: 12.0%


    5: Antarctica

    Total Land Area (sq km): 14,000,000
    Total Land Area (sq miles): 5,400,000
    % of Global Landmass: 9.2%


    6: Europe

    Total Land Area (sq km): 10,180,000
    Total Land Area (sq miles): 3,930,000
    % of Global Landmass: 6.8%


    7: Oceania

    Total Land Area (sq km): 9,037,695
    Total Land Area (sq miles): 3,489,473.5
    % of Global Landmass: 5.9% 

    Continue Reading ...
  • Nuclear Weapons Stockpiles In The World

    US Minuteman III missile inside a silo, near Grand Forks Air Force Base. Each missile carries up to three nuclear warheads

    US Minuteman III missile inside a silo, near Grand Forks Air Force Base. Each missile carries up to three nuclear warheads (image: US Military)

    The list below features all nations who own stockpiles of Nuclear weapons around the World. Whilst this list concerns only the nations who own the stockpiles, sometimes nations could have some of their warheads deployed in other nations under ‘nuclear sharing’ deals – most notably, the United States, who have nuclear weapons deployed in Belgium, Germany, Italy, Netherlands and Turkey (150-200 nuclear warheads in total).

    The World’s overall nuclear arsenal is held by a handful of states, however the vast majority of those bombs have always been owned by Russia and the United States alone. Between them, they have 20 times as many nuclear weapons, as the rest of the World, combined. They could both easily destroy the entire planet – in a matter of seconds – many times over.

    The following list is included, on a yearly basis, as part of the SIPRI Yearbook, by the Stockholm International Peace Research Institute (SIPRI) – a publication which outlines data and analysis in the areas of national security, conflicts, military spending, armaments, non-proliferation, arms control and disarmament.

    World Countries With Nuclear Weapons Stockpiles

    Country Deployed warhead [1] Other warheads [1] Total Inventory [1]
    USA ~2 100 5 200 ~7 300
    Russia ~1 600 ~6 400 ~8 000
    UK 160 ~65 ~225
    France ~290 ~10 ~300
    China . . ~250 ~250
    India . . 90–110 90–110
    Pakistan . . 100–120 100–120
    Israel . . ~80 ~80
    North Korea . . . . 6–8
    Total ~4 150 ~12 200 ~16 350

    World Countries Which Borrow Nuclear Weapons From Other Countries

    Country Borrowed from Nuclear Weapons [2] Comments
    Belgium United States 10-20 NATO-backed ‘Nuclear Sharing’ deal
    Germany United States 10-20 NATO-backed ‘Nuclear Sharing’ deal
    Italy United States 70-90 NATO-backed ‘Nuclear Sharing’ deal
    Netherlands United States 10-20 NATO-backed ‘Nuclear Sharing’ deal
    Turkey United States 50 NATO-backed ‘Nuclear Sharing’ deal
    Previously:
    Canada United States NATO-backed ‘Nuclear Sharing’ deal until 1984
    Greece United States NATO-backed ‘Nuclear Sharing’ deal until 2001

    [1] All estimates are approximate and are as of January 2014, using the latest available data, and featured in the SIPRI 2014 Yearbook. The specific section which includes the data below can be found here.

    [2] “Status of U.S. Nuclear Weapons in Europe 2010” by Hans M. Kristensen, Federation of American Scientists, 2010. This is the most recent version of this data available. 

    Continue Reading ...
  • Michael Moore – Capitalism: A Love Story

    This satirical documentary film revolves around the financial crisis of 2007-2010, and in particular, the recovery stimulus which was brought in by the Bush & Obama administrations.

    Topics covered include Wall Street’s ‘casino mentality’, for-profit prisons, Goldman Sachs’ influence in Washington, DC, the poverty-level wages of many workers, the large wave of home foreclosures, and the consequences of ‘runaway greed’.

    Produced by Michael Moore

    Michael Moore

    Michael Moore is an Academy-Award winning filmmaker and best-selling author. His films ‘Fahrenheit 9/11,’ ‘Capitalism: A Love Story,’ ‘Bowling for Columbine’ and ‘SiCKO’ are among the all-time top grossing documentaries globally. He actively campaigns for a fair healthcare system in the US, more humane foreign policy judgment from US governments, and to bring US troops out of Afghanistan and Iraq. He is also active against viscous corporate power, the corrupt US financial system, and many other causes. His documentary films are always filled with satire, but this does not tend to cloud his argument, and that stylistic talent has arguably made many more people watch his films, than may not have ordinarily done so – thus making many more people aware of various important issues. All of the films we feature contain information that is of great importance to us all 

    Continue Reading ...
  • Overseas Territories around the World

    Maps of UK, US, France and Australia Exclusive Economic Zones [EEZ]This is a handy list featuring all overseas territories and dependencies around the World. This extensive list includes an incredible 78 territories, but many of these territories also contain multiple territories within themselves – such as multiple island groups administered together for handiness.
    Many of these territories are the residue of the past global colonisation by European powers, but there are some listed which represent the new imperialistic intentions of the West, most notably the United States.

    This list includes inhabited and uninhabited territories, comprising of reefs, islands and areas of continental landmass. Some of these dependencies operate almost independently, others have some autonomy, whilst the remainder are administered by the governing nation.

    All of these foreign dependencies represent strategic and/or economic importance to their governing nation, and they can also potentially hold the same importance to other nearby nations in some cases too, which can lead to disputes over these territories.

    According to the United Nations’ Law of the Sea, those who govern a territory have control over underwater/underground exploration – and the control of marine resources – up to 200 nautical miles from its coast. This area is called the Exclusive Economic Zone (EEZ).

    Full List of Overseas Territories

    Overseas Dependency Continent(s) Governing Nation(s)
    Akrotiri and Dhekelia Europe / Asia United Kingdom
    Aland Islands Europe Finland
    American Samoa Oceania United States
    Anguilla North America United Kingdom
    Argentine Antarctica [3] Antarctica Argentina
    Aruba North America Netherlands
    Ashmore & Cartier Islands [3] Oceania Australia
    Australian Antarctic Territory [3] Antarctica Australia
    Bajo Nuevo Bank (Petrel Islands) [3] North America United States / Colombia [1]
    Bonaire North America Netherlands
    Bouvet Island [3] Antarctica Norway
    Bermuda North America United Kingdom
    British Antarctic Territory [3] Antarctica United Kingdom
    British Indian Ocean Territory Asia United Kingdom
    British Virgin Islands North America United Kingdom
    Cayman Islands North America United Kingdom
    Ceuta Africa Spain
    Chilean Antarctic Territory [3] Antarctica Chile
    Christmas Island Asia Australia
    Clipperton Island [3] North America France
    Cocos (Keeling) Islands Asia Australia
    Cook Islands [2] Oceania New Zealand
    Coral Sea Islands [3] Oceania Australia
    Curacao North America Netherlands
    Easter Island Oceania Chile
    Falkland Islands South America United Kingdom
    Faroe Islands Europe Denmark
    Federated States of Micronesia [5] Oceania United States
    French Guiana (Guyane) South America France
    French Polynesia Oceania France
    French Southern & Antarctic Lands [3] Africa / Antarctica / Asia / Oceania France
    Guernsey Europe United Kingdom
    Gibraltar Europe United Kingdom
    Greenland North America Denmark
    Guadeloupe North America France
    Guam Oceania United States
    Heard Island & McDonald Islands [3] Antarctica Australia
    Isle of Man Europe United Kingdom
    Hawaii [6] Oceania United States
    Hong Kong [4] Asia China
    Jan Mayen [3] Europe Norway
    Jersey Europe United Kingdom
    Macau [4] Asia China
    Madeira Africa Portugal
    Marshall Islands [5] Oceania United States
    Martinique North America France
    Mayotte Africa France
    Melilla Africa Spain
    Montserrat North America United Kingdom
    Navassa Island [3] North America United States
    New Caledonia Oceania France
    Niue [2] Oceania New Zealand
    Norfolk Island Oceania Australia
    Northern Mariana Islands Oceania United States
    Palau [5] Oceania United States
    Peter I Island [3] Antarctica Norway
    Puerto Rico North America United States
    Pitcairn Islands Oceania United Kingdom
    Queen Maud Land [3] Antarctica Norway
    Réunion Africa France
    Ross Dependency [3] Antarctica New Zealand
    Saba North America Netherlands
    Saint Barthélemy North America France
    Saint Helena, Ascension & Tristan da Cunha Africa United Kingdom
    Saint Martin North America France
    Saint Pierre & Miquelon North America France
    San Andrés y Providencia North America Colombia
    Serranilla Bank [3] North America United States / Colombia [1]
    Sint Eustatius North America Netherlands
    Sint Maarten North America Netherlands
    South Georgia & The South Sandwich Islands [3] South America United Kingdom
    Svalbard Europe Norway
    Tokelau Oceania New Zealand
    Turks & Caicos Islands North America United Kingdom
    US Pacific Island Wildlife Refuges (Baker Island, Howland Island, Jarvis Island, Johnston Atoll, Kingman Reef, Midway Islands, Palmyra Atoll) [3] Oceania United States
    US Virgin Islands North America United States
    Wake Island [3] Oceania United States
    Wallis and Futuna Oceania France

    [1] Both the United States and Colombia claim ownership, and both administer them seperately.

    [2] This is an independent self-governing nation, but in a free association with New Zealand. New Zealand holds some control over external and defence matters.

    [3] No permanent population.

    [4] Hong Kong and Macau are ‘Special Administrative Regions’ administered by China. You will find lots of datasets on this website which include them as individual stand alone countries, due to a combination of having a history of being treated as such, their population sizes and their precieved status within the international community. Hong Kong was handed over to China by the United Kingdom in 1997, and Macau was handed over by Portugal in 1999 to China.

    [5] This is an independent self-governing nation, but in a free association with the United States, which controls defence, social services, and funding grants.

    [6] Hawaii is considered a state within the United States, and it may be inaccurate to call it an ‘overseas dependency’, but it is an overseas territory. 

    Continue Reading ...
  • Depleted Uranium Statistics – How Much Is There?

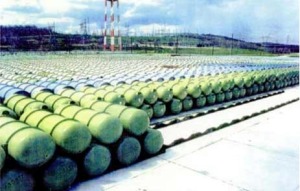
    Depleted Uranium Storage in the USA (image: Depleted UF6 Management Information Network, US Govt)

    The statistics featured below were originally featured in the facts + figures section of BlatantWorld.com. The data itself was sourced from the WISE Uranium Project, regarded by some as the most accurate and up-to-date list of Depleted Uranium stocks around the World.

    As this is the latest data available, we can only be sure of 1 thing; that these stockpiles have grown, and they are most probably substantially larger than what the figures quoted below represent.

    ABOUT THE STATS: The data below was last updated by WISE on the 21st of April 2008, and remains the latest available, as of January 29th 2012. The United States’ figures are for mid-2000, Russia’s estimate is based on “Depleted Uranium from Enrichment, Uranium Institute, London 1996”, China’s estimate is for the end of 2000, Japan’s estimate is for February 2001, and the rest are based on 1999 year-end estimates.

    Country Organisation Total Stock/tonnes
    United States United States Department of Energy 480,000
    Russia Rosatom Nuclear Energy State Corporation 460,000
    France Areva NC 190,000
    United Kingdom British Nuclear Fuels plc 30,000
    Germany,
    Netherlands
    & United Kingdom
    Urenco Group 16,000
    Japan Japan Nuclear Fuel Ltd. 10,000
    China China National Nuclear Corporation 2,000
    South Korea Korea Atomic Energy Research Institute 200
    South Africa South African Nuclear Energy Corporation 73

    Originally sourced from: Depleted Uranium Inventories @ WISE Uranium Project 

    Continue Reading ...
  • Continental Population Growth Around The World 2015-2100

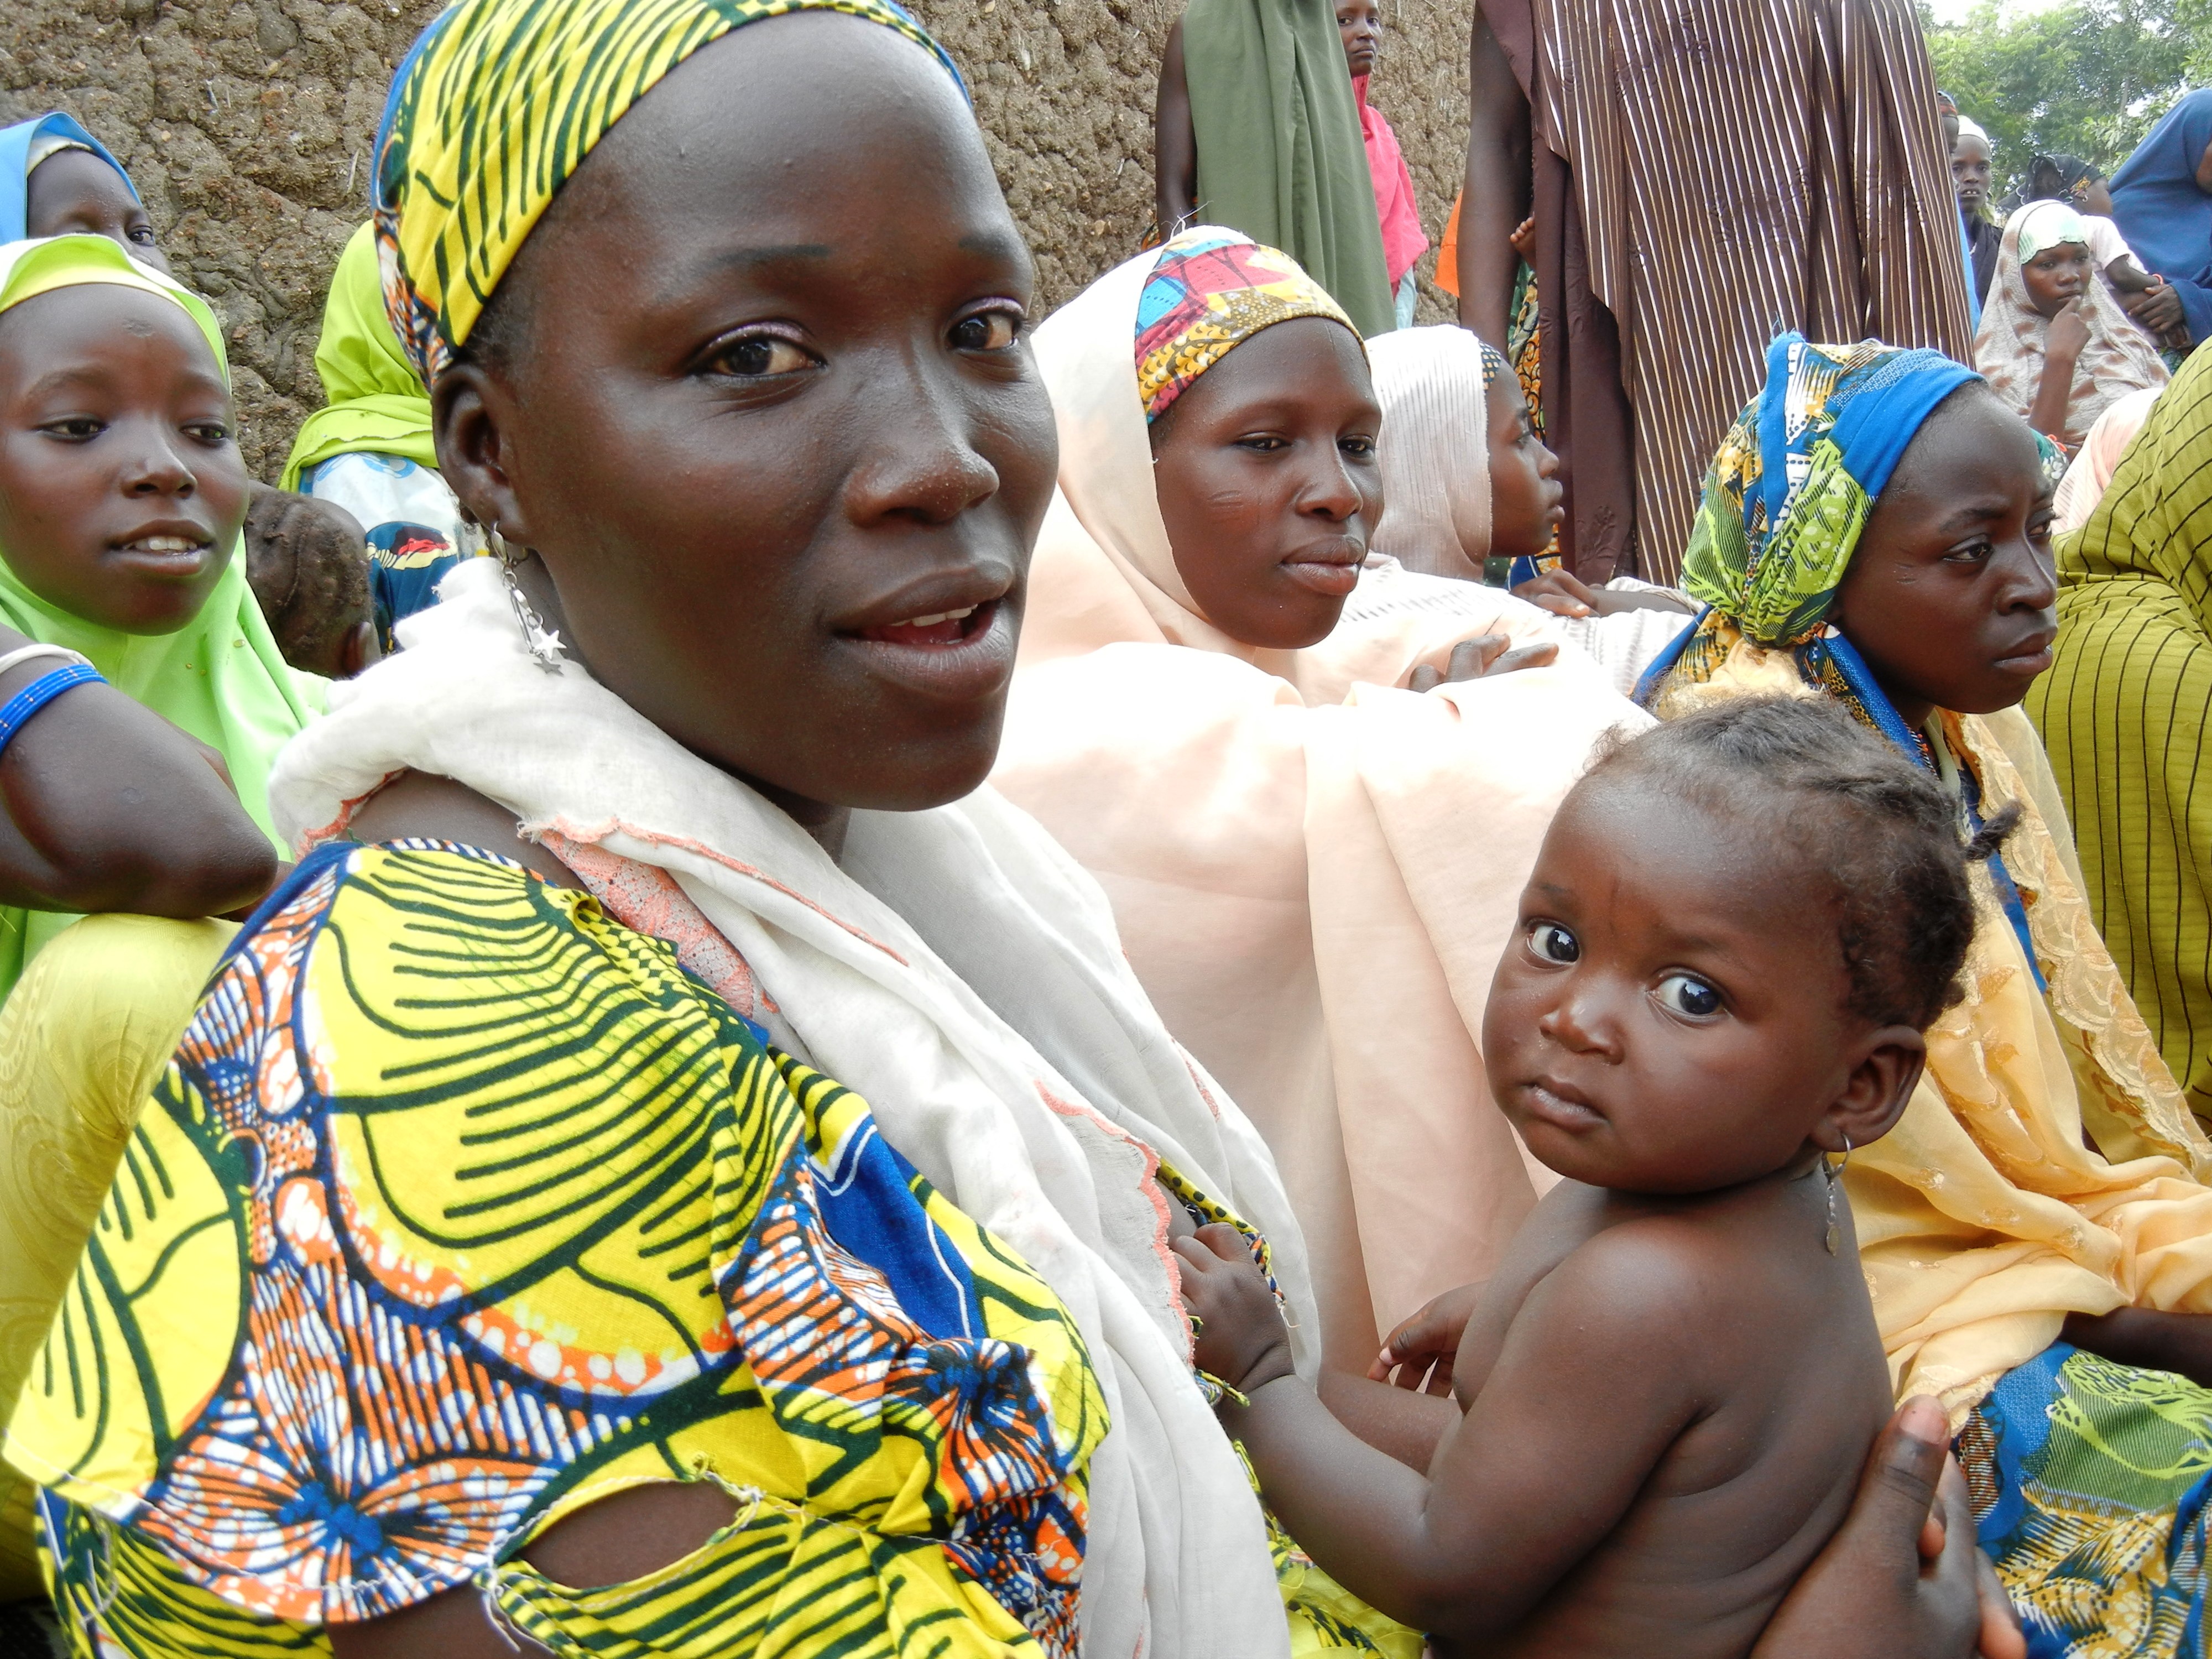
    Women and Kids at Health Clinic in Northern Nigeria, Africa (image: DFID – UK Department for International Development)

    This chart depicts the estimated population changes, between 2015 and 2100, for all of the continents, according to the popular six continent model.

    As you can see, the UN regional population projections depict – in general – that Asia will tail off in the middle of the century, with Africa gaining significant new numbers of people in the second half of the century.

    These totals have been put together by the United Nations Population Division, as part of their latest revision of the ‘World Population Prospects’.

    Please note – the following table is best viewed on tablets or full-sized screens. It may not be 100% viewable on some mobile devices due to its formatting, although if you rotate your mobile screen to view it horizontally, that may do the trick!

    Continental Population around the World

    All figures in millions; 1,000 = 1 billion

    Continent 2015 [1] 2025 [1] 2050 [1] 2100 [1]
    Asia 4,384.8 4,748.9 5,164.1 4,711.5
    Africa 1,166.2 1,468.0 2,393.2 4,184.6
    Europe 743.1 741.0 709.1 638.8
    North America 576.2 628.5 722.7 781.8
    South America 415.1 452.3 505.1 467.5
    Oceania 39.4 44.7 56.9 69.6
    World 7,324.8 8,083.4 9,550.9 10,853.8

    [1] “Total population, both sexes combined” by UNdata, the statistical division of the United Nations. This data was put together by the Department of Economic and Social Affairs – Population Division, Populations Estimates, Projections Section. This data forms part of “World Population Prospects: The 2012 Revision“, the latest available data from the United Nations. Data last updated by the UNdata on 20 August 2013.

    Continental Population StatsPopulation GrowthPopulation StatisticsUnited Nations
      Continue Reading ...
  • The Most Forested Countries in The World (by total % of land)

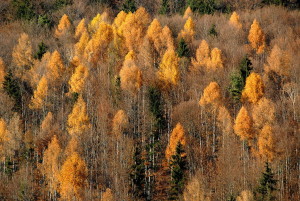
    Larch Forest on Mount Skarbin in Carinthia, Austria

    Larch Forest on Mount Skarbin in Carinthia, Austria (image: Johann Jaritz)

    This is a list of Global nations, listed by the percentage of land (%) forested, in 2010, the latest data available.

    The United Nations Food and Agriculture Organization (FAO) state that they put together this dataset approximately every 5 to 10 years, so it is unclear as to when a new dataset will be released.

    Please note – the following table is best viewed on tablets or full-sized screens. It may not be 100% viewable on some mobile devices due to its formatting, although if you rotate your mobile screen to view it horizontally, that may do the trick!

    World Forestation Chart

    Country Forest area (km2) [1] % of Land Area Forested [1]
    1 French Guiana 80,820 98
    2 Suriname 147,580 95
    3 Micronesia 640 92
    4 American Samoa 180 89
    5 Palau 400 88
    6 Seychelles 410 88
    7 Gabon 220,000 85
    8 Pitcairn 40 83
    9 Turks and Caicos Islands 340 80
    10 Solomon Islands 22,130 79
    11 Guyana 152,050 77
    12 Saint Lucia 470 77
    13 Finland 221,570 73
    14 Brunei 3,800 72
    15 Guinea-Bissau 20,220 72
    16 Niue 190 72
    17 Marshall Islands 130 70
    18 Bhutan 32,490 69
    19 Japan 249,790 69
    20 Sweden 282,030 69
    21 DR Congo 1,541,350 68
    22 Laos 157,510 68
    23 St. Vincent and the Grenadines 270 68
    24 Zambia 494,680 67
    25 Republic of Congo 224,110 66
    26 Northern Mariana Islands 300 66
    27 Cook Islands 160 65
    28 South Korea 62,220 63
    29 Papua New Guinea 287,260 63
    30 Brazil 5,195,220 62
    31 Malaysia 204,560 62
    32 Puerto Rico 5,520 62
    33 Slovenia 12,530 62
    34 Belize 13,930 61
    35 Anguilla 60 60
    36 Dominica 450 60
    37 Samoa 1,710 60
    38 Equatorial Guinea 16,260 58
    39 United States Virgin Islands 200 58
    40 Cambodia 100,940 57
    41 Fiji 10,140 56
    42 Colombia 604,990 55
    43 Latvia 33,540 54
    44 Bolivia 571,960 53
    45 Peru 679,920 53
    46 Estonia 22,170 52
    47 Indonesia 944,320 52
    48 Venezuela 462,750 52
    49 Bahamas 5,150 51
    50 Costa Rica 26,050 51
    51 Cayman Islands 130 50
    52 Grenada 170 50
    53 Mozambique 390,220 50
    54 East Timor 7,420 50
    55 Russia 8,090,900 49
    56 Gambia 4,800 48
    57 Burma 317,730 48
    58 Angola 584,800 47
    59 Austria 38,870 47
    60 Guam 260 47
    61 North Korea 56,660 47
    62 Honduras 51,920 46
    63 Martinique 490 46
    64 New Caledonia 8,390 46
    65 Liberia 43,290 45
    66 Panama 32,510 44
    67 Paraguay 175,820 44
    68 Senegal 84,730 44
    69 Trinidad and Tobago 2,260 44
    70 Vietnam 137,970 44
    71 Bosnia and Herzegovina 21,850 43
    72 Liechtenstein 70 43
    73 Belarus 86,300 42
    74 Cameroon 199,160 42
    75 French Polynesia 1,550 42
    76 Saint Kitts and Nevis 110 42
    77 Wallis and Futuna Islands 60 42
    78 Benin 45,610 41
    79 Dominican Republic 19,720 41
    80 Montenegro 5,430 40
    81 Slovakia 19,330 40
    82 Zimbabwe 156,240 40
    83 Georgia 27,420 39
    84 Guadeloupe 640 39
    85 Macedonia 9,980 39
    86 Portugal 34,560 38
    87 Sierra Leone 27,260 38
    88 Tanzania 334,280 38
    89 Mayotte 140 37
    90 Thailand 189,720 37
    91 Andorra 160 36
    92 Bulgaria 39,270 36
    93 Central African Republic 226,050 36
    94 Ecuador 98,650 36
    95 Spain 181,730 36
    96 Vanuatu 4,400 36
    97 Réunion 880 35
    98 Canada 3,101,340 34
    99 Croatia 19,200 34
    100 Czech Republic 26,570 34
    101 Guatemala 36,570 34
    102 Lithuania 21,600 34
    103 Malawi 32,370 34
    104 Ivory Coast 104,030 33
    105 Luxembourg 870 33
    106 Mexico 648,020 33
    107 Norway 100,650 33
    108 Swaziland 5,630 33
    109 Tuvalu 10 33
    110 United States 3,040,220 33
    111 Germany 110,760 32
    112 Italy 91,490 31
    113 Jamaica 3,370 31
    114 New Zealand 82,690 31
    115 Serbia 27,130 31
    116 Switzerland 12,400 31
    117 Greece 39,030 30
    118 Poland 93,370 30
    119 France 159,540 29
    120 Romania 65,730 29
    121 Sri Lanka 18,600 29
    122 Sudan 699,490 29
    123 Albania 7,760 28
    124 Sao Tome and Principe 270 28
    125 Guinea 65,440 27
    126 Cuba 28,700 26
    127 Nicaragua 31,140 26
    128 Philippines 76,650 26
    129 Nepal 36,360 25
    130 British Virgin Islands 40 24
    131 Montserrat 30 24
    132 Hungary 20,290 23
    133 India 684,340 23
    134 Antigua and Barbuda 100 22
    135 Belgium 6,780 22
    136 Chile 162,310 22
    137 China 2,068,610 22
    138 Ghana 49,400 22
    139 Madagascar 125,530 22
    140 Burkina Faso 56,490 21
    141 Cape Verde 850 21
    142 Bermuda 10 20
    143 Botswana 113,510 20
    144 Australia 1,493,000 19
    145 Barbados 80 19
    146 Republic of Cyprus 1,730 19
    147 Rwanda 4,350 18
    148 Mauritius 350 17
    149 Ukraine 97,050 17
    150 Eritrea 15,320 15
    151 Kiribati 120 15
    152 Turkey 113,340 15
    153 Uganda 29,880 15
    154 El Salvador 2,870 14
    155 Denmark 5,440 13
    156 Lebanon 1,370 13
    157 Saint Pierre and Miquelon 30 13
    158 Tonga 90 13
    159 Norfolk Island 0 12
    160 Moldova 3,860 12
    161 United Kingdom 28,810 12
    162 Argentina 294,000 11
    163 Azerbaijan 9,360 11
    164 Bangladesh 14,420 11
    165 Ethiopia 122,960 11
    166 Republic of Ireland 7,390 11
    167 Morocco 51,310 11
    168 Netherlands 3,650 11
    169 Somalia 67,470 11
    170 Mali 124,900 10
    171 Nigeria 90,410 10
    172 Uruguay 17,440 10
    173 Armenia 2,620 9
    174 Chad 115,250 9
    175 Namibia 72,900 9
    176 Turkmenistan 41,270 9
    177 South Africa 92,410 8
    178 Uzbekistan 32,760 8
    179 Burundi 1,720 7
    180 Iran 110,750 7
    181 Israel 1,540 7
    182 Mongolia 108,980 7
    183 Isle of Man 30 6
    184 Kenya 34,670 6
    185 Saint Helena 20 6
    186 Tunisia 10,060 6
    187 Jersey 10 5
    188 Kyrgyzstan 9,540 5
    189 Togo 2,870 5
    190 Haiti 1,010 4
    191 United Arab Emirates 3,170 4
    192 Guernsey 0 3
    193 Maldives 10 3
    194 Singapore 20 3
    195 Syria 4,910 3
    196 Tajikistan 4,100 3
    197 Western Sahara 7,070 3
    198 Afghanistan 13,500 2
    199 Aruba 0 2
    200 Comoros 30 2
    201 Iraq 8,250 2
    202 Occupied Palestinian Territory 90 2
    203 Pakistan 16,870 2
    204 Algeria 14,920 1
    205 Bahrain 10 1
    206 Jordan 980 1
    207 Kazakhstan 33,090 1
    208 Lesotho 440 1
    209 Malta 0 1
    210 Netherlands Antilles 10 1
    211 Niger 12,040 1
    212 Yemen 5,490 1
    213 Saudi Arabia 9,770 0
    214 Mauritania 2,420 0
    215 Libya 2,170 0
    216 Egypt 700 0
    217 Iceland 300 0
    218 Djibouti 60 0
    219 Kuwait 60 0
    220 Oman 20 0
    221 Falkland Islands 0 0
    222 Faeroe Islands 0 0
    223 Gibraltar 0 0
    224 Greenland 0 0
    226 Monaco 0 0
    227 Nauru 0 0
    228 Qatar 0 0
    229 San Marino 0 0
    230 Tokelau 0 0
    225 Vatican City 0 0

    [1] “ENVIRONMENTAL INDICATORS: Forests” United Nations Statistics Division – Statistics compiled by the Food and Agriculture Organization of the United Nations (FAO). Last updated by the United Nations in December 2010, last retrieved by BlatantWorld.com on 21 January 2015.

    Forest includes natural forests and forest plantations. It is used to refer to land with a tree canopy cover of more than 10 per cent and area of more than 0.5 ha. Forests are determined both by the presence of trees and the absence of other predominant land uses. The trees should be able to reach a minimum height of 5 m. Young stands that have not yet but are expected to reach a crown density of 10 percent and tree height of 5 m are included under forest, as are temporarily unstocked areas. The term includes forests used for purposes of production, protection, multiple-use or conservation (i.e. forest in national parks, nature reserves and other protected areas), as well as forests stands on agricultral lands (e.g. windbreaks and shelterbelts of trees with a width of more than 20 m), and rubberwood plantations and cork oak stands. The term specifically excludes stands of trees established primarily for agricultural production, for example fruit tree plantations. It also excludes trees planted in agroforestry systems.

    Data Quality: Although there is an agreed and clear definition of forest, not all countries apply this definition. In many northern countries, areas with a crown cover of less than 20% are not considered as real forest land. ‘Temporarily unstocked areas’ refer to areas that have been designated as forest area, but not yet planted, or more often, areas where storm or fire has removed a large part of the forest cover. Unless aggressively restocked with trees, such areas can take a long time to re-establish forests naturally. 

    Continue Reading ...
  • John Fitzgerald Kennedy – The Very Word Secrecy Is Repugnant

    [Audio Only] John F. Kennedy made this speech on April the 27th, 1961, before the American Newspaper Publishers Association at the Waldorf-Astoria Hotel in New York. It contains many famous passages, including those mysterious words alluding to a dark and powerful enemy which is secretively amongst us. Many people speculate that this secretive enemy is the military-industrial complex. JFK was assassinated about 1 year after this speech and many believe that the reasons for his departure are hidden in these very words. He was trying to expose them, and they decided that it was time for him to go.

    Entire Text Transcript Of Speech

    Mr. Chairman, ladies and gentlemen:

    I appreciate very much your generous invitation to be here tonight.

    You bear heavy responsibilities these days and an article I read some time ago reminded me of how particularly heavily the burdens of present day events bear upon your profession.

    11 June 1963 – John F. Kennedy addresses nation on Civil Rights (image: White House)

    You may remember that in 1851 the New York Herald Tribune under the sponsorship and publishing of Horace Greeley, employed as its London correspondent an obscure journalist by the name of Karl Marx.

    We are told that foreign correspondent Marx, stone broke, and with a family ill and undernourished, constantly appealed to Greeley and managing editor Charles Dana for an increase in his munificent salary of $5 per installment, a salary which he and Engels ungratefully labeled as the “lousiest petty bourgeois cheating.”

    But when all his financial appeals were refused, Marx looked around for other means of livelihood and fame, eventually terminating his relationship with the Tribune and devoting his talents full time to the cause that would bequeath the world the seeds of Leninism, Stalinism, revolution and the cold war.

    If only this capitalistic New York newspaper had treated him more kindly; if only Marx had remained a foreign correspondent, history might have been different. And I hope all publishers will bear this lesson in mind the next time they receive a poverty-stricken appeal for a small increase in the expense account from an obscure newspaper man.

    I have selected as the title of my remarks tonight “The President and the Press.” Some may suggest that this would be more naturally worded “The President Versus the Press.” But those are not my sentiments tonight.

    It is true, however, that when a well-known diplomat from another country demanded recently that our State Department repudiate certain newspaper attacks on his colleague it was unnecessary for us to reply that this Administration was not responsible for the press, for the press had already made it clear that it was not responsible for this Administration.

    Nevertheless, my purpose here tonight is not to deliver the usual assault on the so-called one party press. On the contrary, in recent months I have rarely heard any complaints about political bias in the press except from a few Republicans. Nor is it my purpose tonight to discuss or defend the televising of Presidential press conferences. I think it is highly beneficial to have some 20,000,000 Americans regularly sit in on these conferences to observe, if I may say so, the incisive, the intelligent and the courteous qualities displayed by your Washington correspondents.

    Nor, finally, are these remarks intended to examine the proper degree of privacy which the press should allow to any President and his family.

    If in the last few months your White House reporters and photographers have been attending church services with regularity, that has surely done them no harm.

    On the other hand, I realize that your staff and wire service photographers may be complaining that they do not enjoy the same green privileges at the local golf courses that they once did.

    It is true that my predecessor did not object as I do to pictures of one’s golfing skill in action. But neither on the other hand did he ever bean a Secret Service man.

    My topic tonight is a more sober one of concern to publishers as well as editors.

    I want to talk about our common responsibilities in the face of a common danger. The events of recent weeks may have helped to illuminate that challenge for some; but the dimensions of its threat have loomed large on the horizon for many years. Whatever our hopes may be for the future–for reducing this threat or living with it–there is no escaping either the gravity or the totality of its challenge to our survival and to our security–a challenge that confronts us in unaccustomed ways in every sphere of human activity.

    This deadly challenge imposes upon our society two requirements of direct concern both to the press and to the President–two requirements that may seem almost contradictory in tone, but which must be reconciled and fulfilled if we are to meet this national peril. I refer, first, to the need for a far greater public information; and, second, to the need for far greater official secrecy.

    The very word “secrecy” is repugnant in a free and open society; and we are as a people inherently and historically opposed to secret societies, to secret oaths and to secret proceedings. We decided long ago that the dangers of excessive and unwarranted concealment of pertinent facts far outweighed the dangers which are cited to justify it. Even today, there is little value in opposing the threat of a closed society by imitating its arbitrary restrictions. Even today, there is little value in insuring the survival of our nation if our traditions do not survive with it. And there is very grave danger that an announced need for increased security will be seized upon by those anxious to expand its meaning to the very limits of official censorship and concealment. That I do not intend to permit to the extent that it is in my control. And no official of my Administration, whether his rank is high or low, civilian or military, should interpret my words here tonight as an excuse to censor the news, to stifle dissent, to cover up our mistakes or to withhold from the press and the public the facts they deserve to know.

    But I do ask every publisher, every editor, and every newsman in the nation to reexamine his own standards, and to recognize the nature of our country’s peril. In time of war, the government and the press have customarily joined in an effort based largely on self-discipline, to prevent unauthorized disclosures to the enemy. In time of “clear and present danger,” the courts have held that even the privileged rights of the First Amendment must yield to the public’s need for national security.

    Today no war has been declared–and however fierce the struggle may be, it may never be declared in the traditional fashion. Our way of life is under attack. Those who make themselves our enemy are advancing around the globe. The survival of our friends is in danger. And yet no war has been declared, no borders have been crossed by marching troops, no missiles have been fired.

    If the press is awaiting a declaration of war before it imposes the self-discipline of combat conditions, then I can only say that no war ever posed a greater threat to our security. If you are awaiting a finding of “clear and present danger,” then I can only say that the danger has never been more clear and its presence has never been more imminent.

    It requires a change in outlook, a change in tactics, a change in missions–by the government, by the people, by every businessman or labor leader, and by every newspaper. For we are opposed around the world by a monolithic and ruthless conspiracy that relies primarily on covert means for expanding its sphere of influence–on infiltration instead of invasion, on subversion instead of elections, on intimidation instead of free choice, on guerrillas by night instead of armies by day. It is a system which has conscripted vast human and material resources into the building of a tightly knit, highly efficient machine that combines military, diplomatic, intelligence, economic, scientific and political operations.

    Its preparations are concealed, not published. Its mistakes are buried, not headlined. Its dissenters are silenced, not praised. No expenditure is questioned, no rumor is printed, no secret is revealed. It conducts the Cold War, in short, with a war-time discipline no democracy would ever hope or wish to match.

    Nevertheless, every democracy recognizes the necessary restraints of national security–and the question remains whether those restraints need to be more strictly observed if we are to oppose this kind of attack as well as outright invasion.

    For the facts of the matter are that this nation’s foes have openly boasted of acquiring through our newspapers information they would otherwise hire agents to acquire through theft, bribery or espionage; that details of this nation’s covert preparations to counter the enemy’s covert operations have been available to every newspaper reader, friend and foe alike; that the size, the strength, the location and the nature of our forces and weapons, and our plans and strategy for their use, have all been pinpointed in the press and other news media to a degree sufficient to satisfy any foreign power; and that, in at least in one case, the publication of details concerning a secret mechanism whereby satellites were followed required its alteration at the expense of considerable time and money. 

    Continue Reading ...
  • The Most Re-Forested Countries in The World

    This is a list of Global nations, listed by the amount of land (km2) that has been reforested, between 1990 and 2010, the latest data available.

    The United Nations Food and Agriculture Organization (FAO) state that they put together this dataset approximately every 5 to 10 years, so it is unclear as to when a new dataset will be released.

    Please note – the following table is best viewed on tablets or full-sized screens. It may not be 100% viewable on some mobile devices due to its formatting, although if you rotate your mobile screen to view it horizontally, that may do the trick!

    World Forestation Chart

    Country km2 Forested – 1990 [1] km2 Forested – 2010 [1] % Change
    1 Iceland 90 300 233.3
    2 French Polynesia 550 1,550 181.8
    3 Bahrain 0 10 100.0
    4 Kuwait 30 60 100.0
    5 Puerto Rico 2,870 5,520 92.3
    6 Uruguay 9,200 17,440 89.6
    7 Egypt 440 700 59.1
    8 Republic of Ireland 4,650 7,390 58.9
    9 Tunisia 6,430 10,060 56.5
    10 Vietnam 93,630 137,970 47.4
    11 Cape Verde 580 850 46.6
    12 Cuba 20,580 28,700 39.5
    13 Rwanda 3,180 4,350 36.8
    14 Syria 3,720 4,910 32.0
    15 China 1,571,410 2,068,610 31.6
    16 Samoa 1,300 1,710 31.5
    17 Spain 138,180 181,730 31.5
    18 United Arab Emirates 2,450 3,170 29.4
    19 Denmark 4,450 5,440 22.2
    20 Moldova 3,190 3,860 21.0
    21 Italy 75,900 91,490 20.5
    22 Swaziland 4,720 5,630 19.3
    23 Greece 32,990 39,030 18.3
    24 Bulgaria 33,270 39,270 18.0
    25 Serbia 23,130 27,130 17.3
    26 Turkey 96,800 113,340 17.1
    27 Israel 1,320 1,540 16.7
    28 Philippines 65,700 76,650 16.7
    29 Kyrgyzstan 8,360 9,540 14.1
    30 Hungary 18,010 20,290 12.7
    31 Lithuania 19,450 21,600 11.1
    32 Belarus 77,800 86,300 10.9
    33 United Kingdom 26,110 28,810 10.3
    34 Norway 91,300 100,650 10.2
    35 Lesotho 400 440 10.0
    36 France 145,370 159,540 9.7
    37 Macedonia 9,120 9,980 9.4
    38 Gambia 4,420 4,800 8.6
    39 St. Vincent and the Grenadines 250 270 8.0
    40 Switzerland 11,510 12,400 7.7
    41 Uzbekistan 30,450 32,760 7.6
    42 Republic of Cyprus 1,610 1,730 7.5
    43 New Zealand 77,200 82,690 7.1
    44 Bhutan 30,350 32,490 7.1
    45 India 639,390 684,340 7.0
    46 Saint Lucia 440 470 6.8
    47 Cook Islands 150 160 6.7
    48 Fiji 9,530 10,140 6.4
    49 Chile 152,630 162,310 6.3
    50 Estonia 20,900 22,170 6.1
    51 Netherlands 3,450 3,650 5.8
    52 Latvia 31,730 33,540 5.7
    53 Slovenia 11,880 12,530 5.5
    54 Palau 380 400 5.3
    55 Poland 88,810 93,370 5.1
    56 Ukraine 92,740 97,050 4.6
    57 Lebanon 1,310 1,370 4.6
    58 Portugal 33,270 34,560 3.9
    59 Croatia 18,500 19,200 3.8
    60 Sweden 272,810 282,030 3.4
    61 Romania 63,710 65,730 3.2
    62 Germany 107,410 110,760 3.1
    63 Austria 37,760 38,870 2.9
    64 Iraq 8,040 8,250 2.6
    65 United States 2,963,350 3,040,220 2.6
    66 Ivory Coast 102,220 104,030 1.8
    67 Morocco 50,490 51,310 1.6
    68 Costa Rica 25,640 26,050 1.6
    69 Finland 218,890 221,570 1.2
    70 Luxembourg 860 870 1.2
    71 Réunion 870 880 1.1
    72 Czech Republic 26,290 26,570 1.1
    73 Slovakia 19,220 19,330 0.6
    74 Tajikistan 4,080 4,100 0.5
    75 Belgium 6,770 6,780 0.1
    76 Japan 249,500 249,790 0.1
    77 Russia 8,089,500 8,090,900 0.0

    Global Countries With No Change In Overall Forested Area Between 1990 and 2010

    Country km2 Forested in both 1990 and 2010 [1]
    Afghanistan 13,500
    American Samoa 180
    Andorra 160
    Anguilla 60
    Antigua and Barbuda 100
    Aruba 0
    Azerbaijan 9,360
    Bahamas 5,150
    Barbados 80
    Bermuda 10
    British Virgin Islands 40
    Canada 3,101,340
    Cayman Islands 130
    Djibouti 60
    Dominican Republic 19,720
    Falkland Islands 0
    Faeroe Islands 0
    Gabon 220,000
    Gibraltar 0
    Greenland 0
    Grenada 170
    Guam 260
    Guernsey 0
    Guyana 152,050
    Iran 110,750
    Isle of Man 30
    Jersey 10
    Jordan 980
    Kiribati 120
    Libya 2,170
    Liechtenstein 70
    Maldives 10
    Malta 0
    Marshall Islands 130
    Martinique 490
    Micronesia 640
    Monaco 0
    Montenegro 5,430
    Nauru 0
    Netherlands Antilles 10
    New Caledonia 8,390
    Norfolk Island 0
    Occupied Palestinian Territory 90
    Oman 20
    Pitcairn 40
    Qatar 0
    Saint Helena 20
    Saint Kitts and Nevis 110
    Saint Pierre and Miquelon 30
    San Marino 0
    Sao Tome and Principe 270
    Saudi Arabia 9,770
    Seychelles 410
    Singapore 20
    South Africa 92,410
    Tokelau 0
    Tonga 90
    Turkmenistan 41,270
    Turks and Caicos Islands 340
    Tuvalu 10
    Vanuatu 4,400
    Vatican City 0
    Wallis and Futuna Islands 60
    Western Sahara 7,070
    Yemen 5,490

    [1] “ENVIRONMENTAL INDICATORS: Forests” United Nations Statistics Division – Statistics compiled by the Food and Agriculture Organization of the United Nations (FAO). Last updated by the United Nations in December 2010, last retrieved by BlatantWorld.com on 21 January 2015.

    Forest includes natural forests and forest plantations. It is used to refer to land with a tree canopy cover of more than 10 per cent and area of more than 0.5 ha. Forests are determined both by the presence of trees and the absence of other predominant land uses. The trees should be able to reach a minimum height of 5 m. Young stands that have not yet but are expected to reach a crown density of 10 percent and tree height of 5 m are included under forest, as are temporarily unstocked areas. The term includes forests used for purposes of production, protection, multiple-use or conservation (i.e. forest in national parks, nature reserves and other protected areas), as well as forests stands on agricultral lands (e.g. windbreaks and shelterbelts of trees with a width of more than 20 m), and rubberwood plantations and cork oak stands. The term specifically excludes stands of trees established primarily for agricultural production, for example fruit tree plantations. It also excludes trees planted in agroforestry systems.

    Data Quality: Although there is an agreed and clear definition of forest, not all countries apply this definition. In many northern countries, areas with a crown cover of less than 20% are not considered as real forest land. ‘Temporarily unstocked areas’ refer to areas that have been designated as forest area, but not yet planted, or more often, areas where storm or fire has removed a large part of the forest cover. Unless aggressively restocked with trees, such areas can take a long time to re-establish forests naturally. 

    Continue Reading ...